> ## Documentation Index
> Fetch the complete documentation index at: https://docs.deeprails.com/llms.txt
> Use this file to discover all available pages before exploring further.
# Monitor Overview
> Monitor is the 'Airtag' for GenAI workflows - it gives you full observability over every generative AI workflow you run. It continuously scores outputs with DeepRails’ Guardrail Metrics; tracks usage, cost, latency, and failure rates in real time; and surfaces regressions before they reach your users.
## Why Monitor Exists
Blind spots in production GenAI cost teams time, money, and trust. Monitor identifies and closes those gaps. It evaluates live traffic with the same research-backed Guardrail Metrics and Extended AI Capabilities used across DeepRails and highlights trends and regressions so you can fix issues fast and improve with confidence.
## Key Definitions
* **Guardrail Metrics:** DeepRails’ General-Purpose Guardrail Metrics for correctness, completeness, adherence (instruction, context, ground truth), and comprehensive safety. Custom Guardrail Metrics are supported on SME & Enterprise plans.
* **Monitor:** A read-only evaluation pipeline for a specific LLM use case or surface. A monitor receives your input/output pairs and model metadata, scores them with selected guardrails, and exposes real-time metrics, trends, and drill-downs. It does **not** remediate outputs (use **Defend** for correction).
* **Nametag:** An optional label you attach to events (e.g., “staging”, “release-2025-09”, “feature-x”) to slice charts, compare cohorts, and run A/B or pre/post analyses.
* **Extended AI Capabilities:** Many LLM applications have to go beyond model knowledge. DeepRails provides access to advanced tools like web and file search and context awareness for evaluations if needed.
## How to Use Monitor
Maximizing Monitor's diagnostic potential is simple when following these steps:
Name the use case you want to observe and select the guardrail metrics to apply. If the use case being monitored uses tools like file or web search, enable those Extended AI Capabilities for the Monitor.
Send each model completion (input/output pair, model used, and optional nametag). Monitor ingests this traffic continuously from staging or production.
Monitor scores every output against your selected guardrails, associates operational signals (latency, tokens, cost), and indexes the event for search and analysis.
Dashboards update in real time—track request volume, failure rate, latency, tokens, and cost; examine guardrail distributions; compare cohorts via filters and time windows.
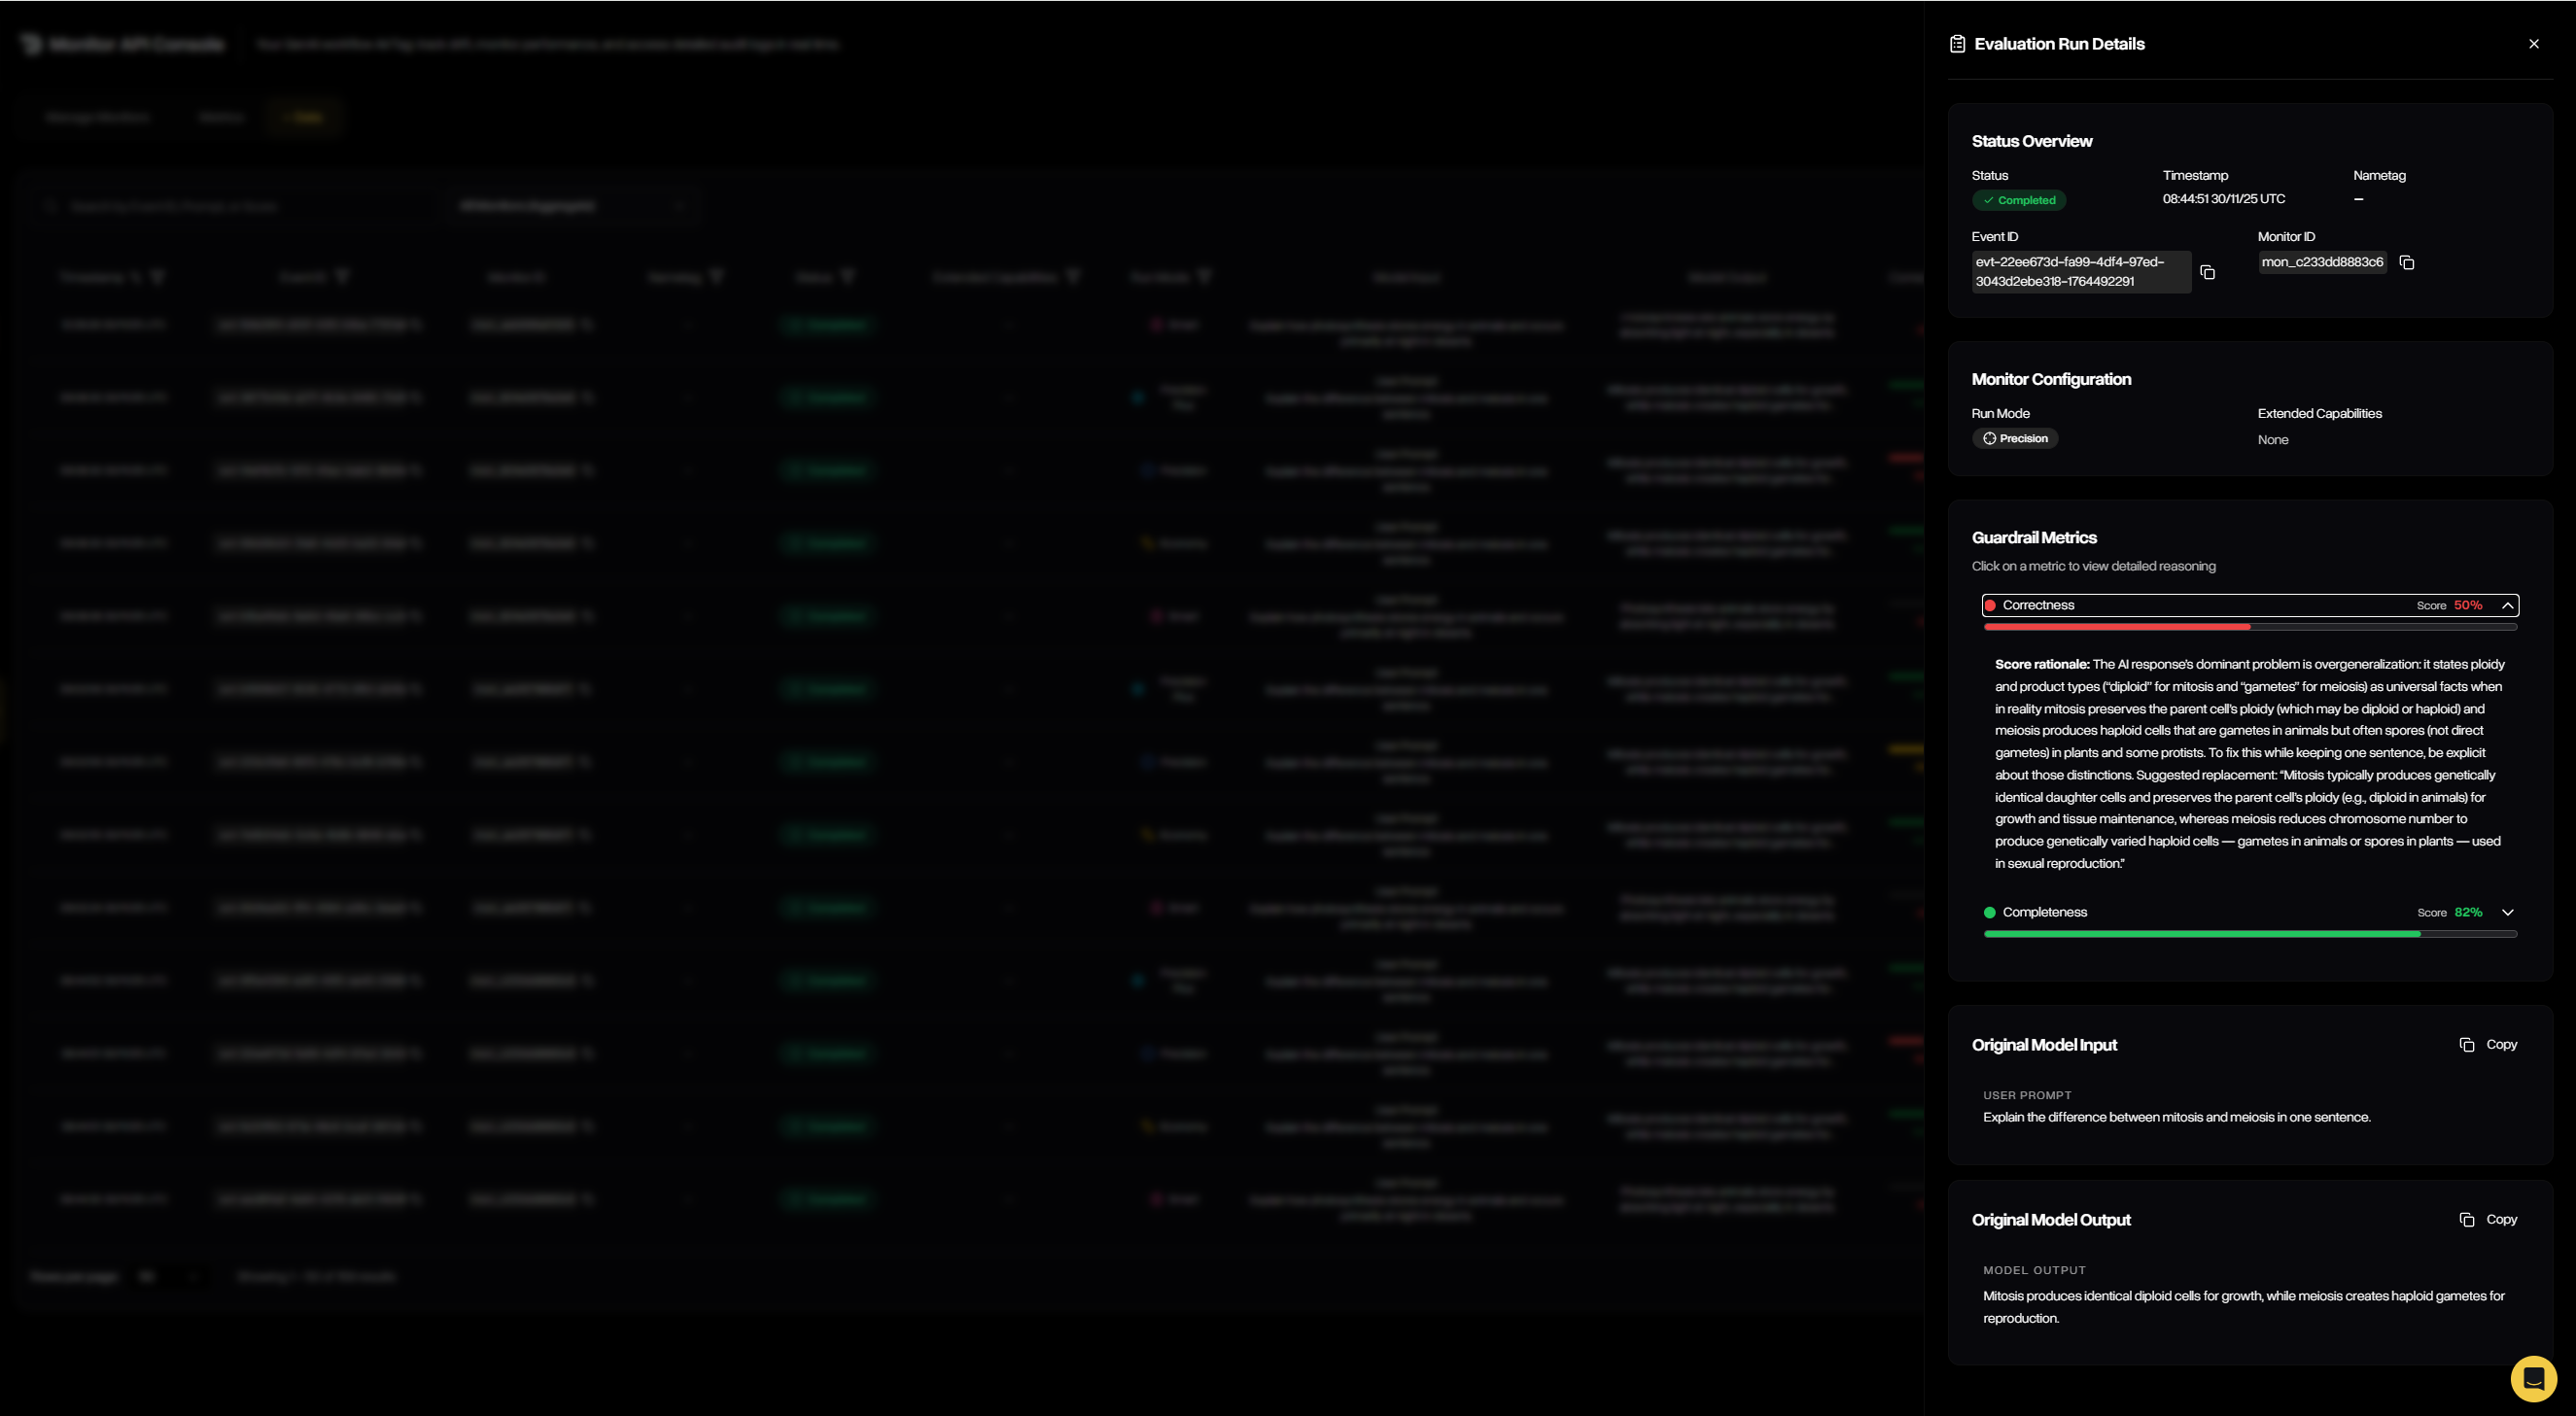
Drill into any event to see per-metric scores and rationales. Use findings to fix prompts, tune models, adjust thresholds, and more.
## Console Walkthrough
The Monitor Console brings observability to life across three tabs: **Metrics**, **Data**, and **Manage Monitors**.
### Monitor Metrics
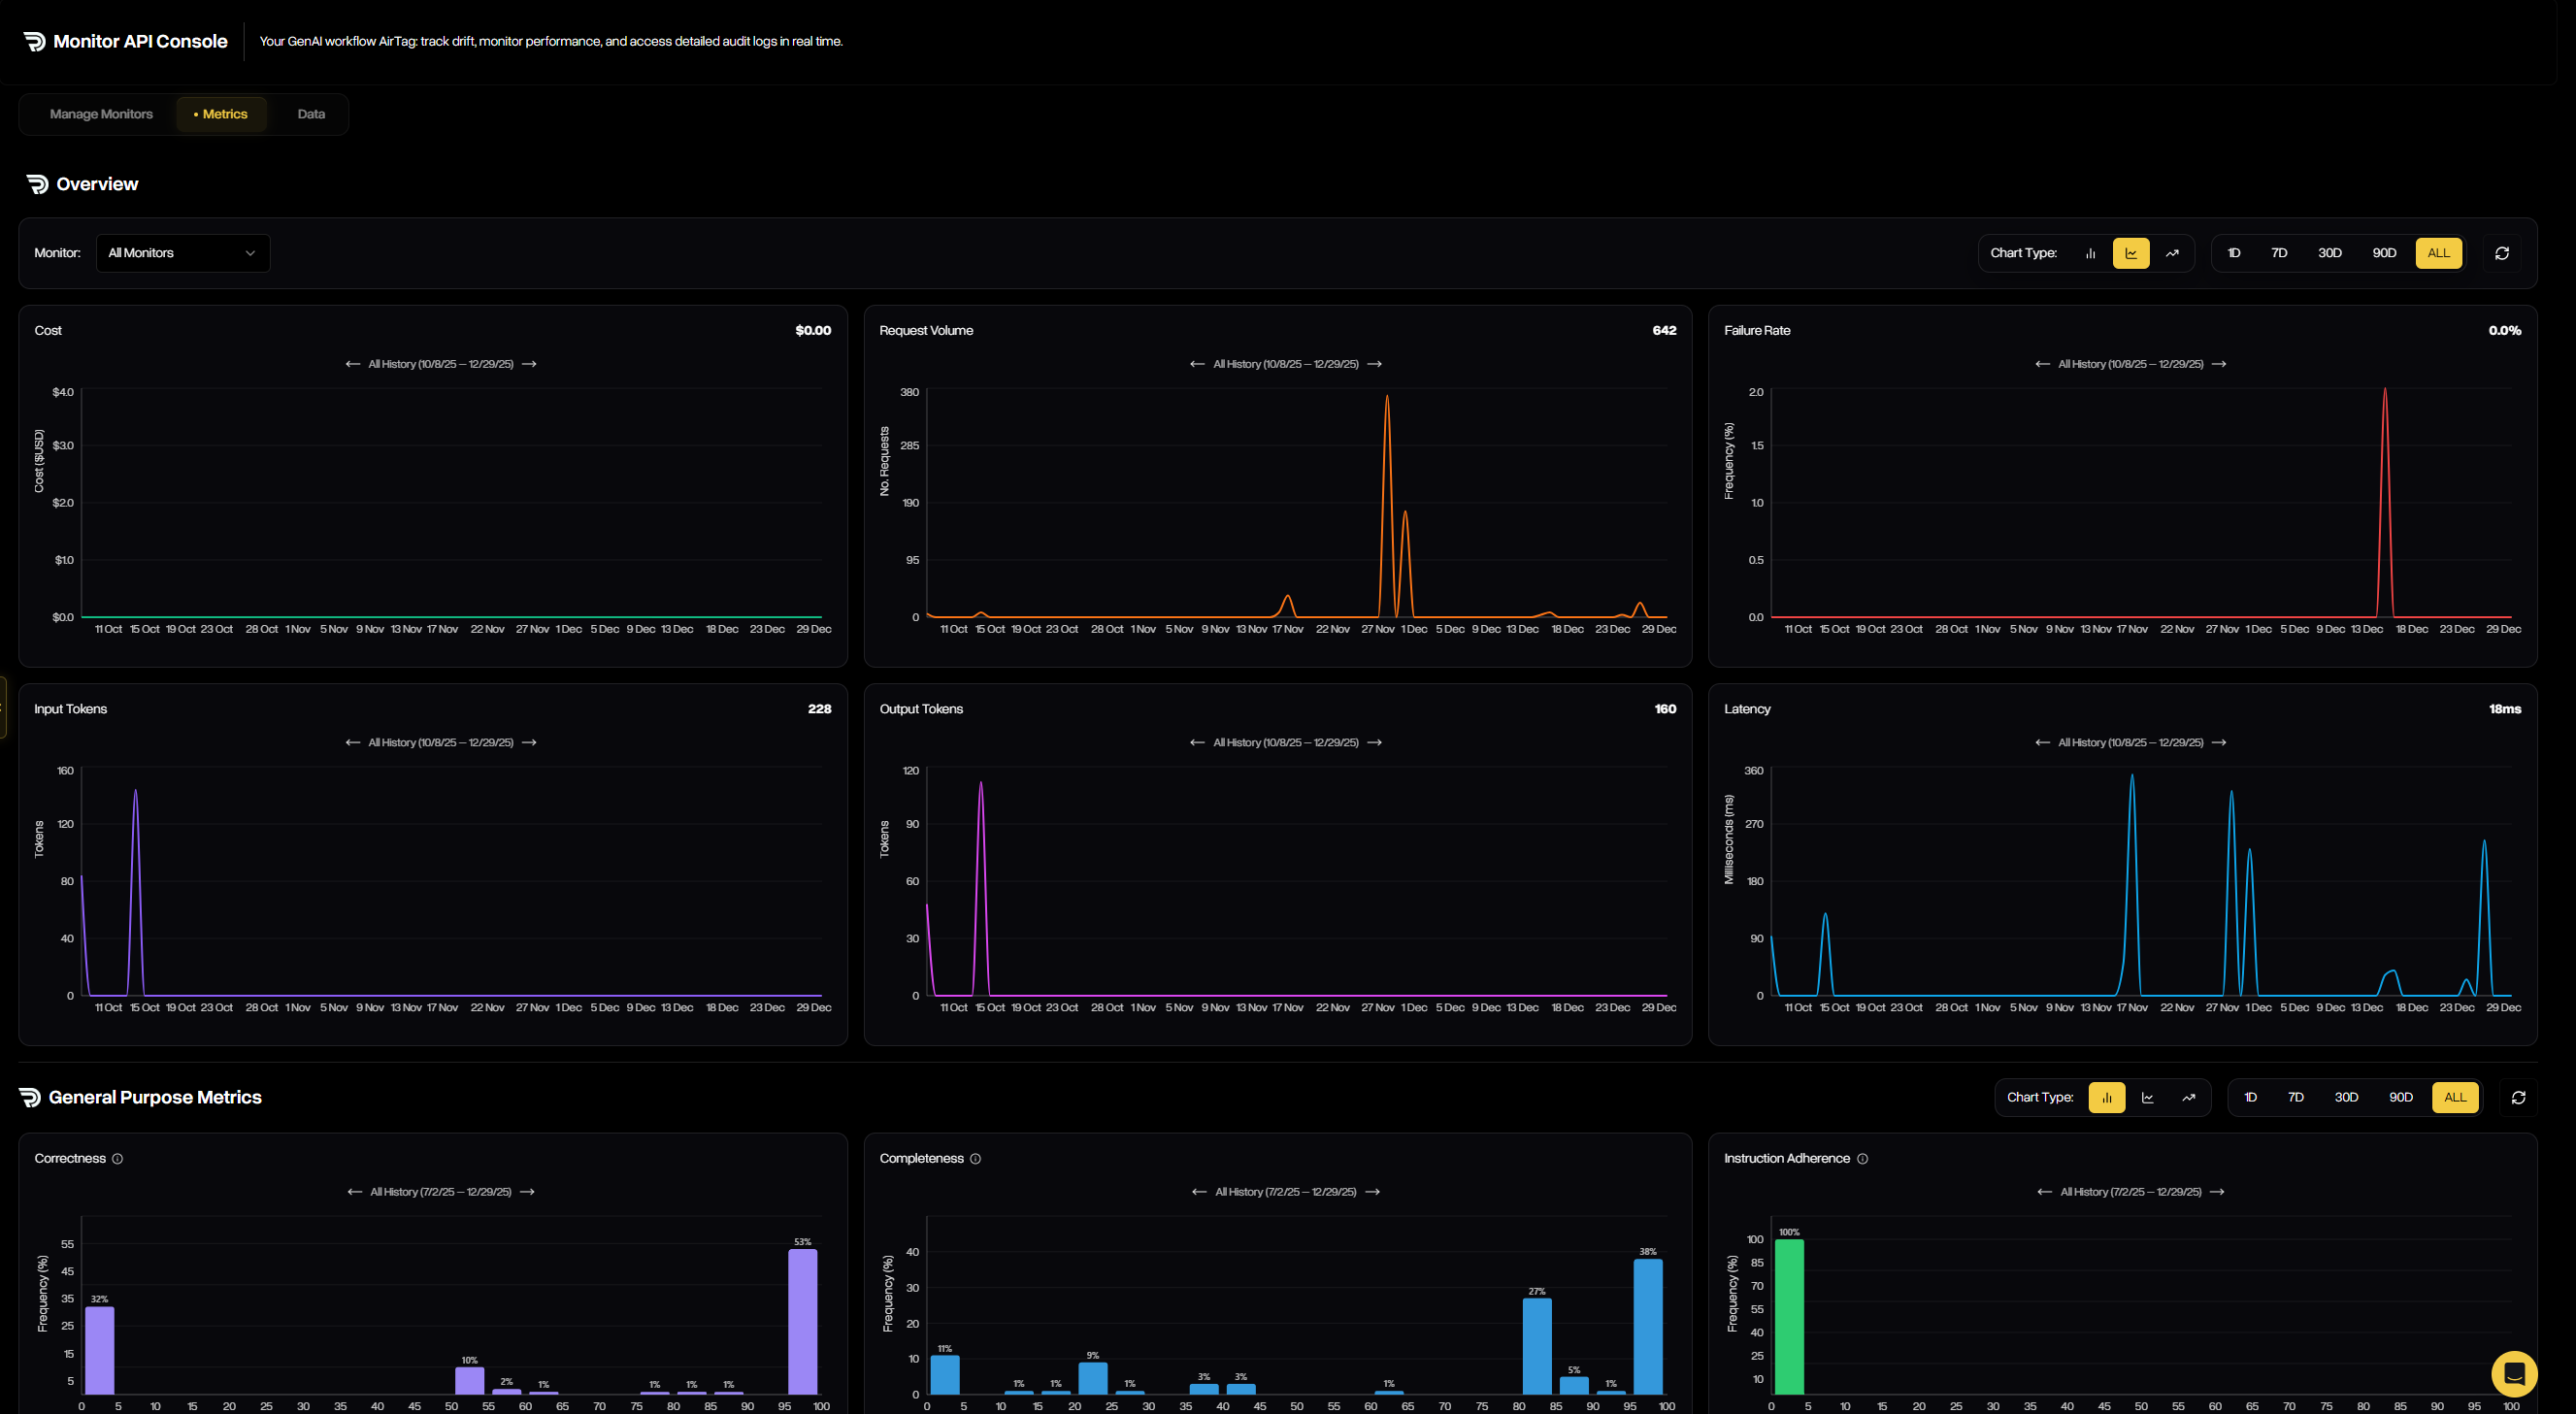
The **Monitor Metrics** tab shows real-time operational and quality performance for a selected monitor: request volume, failure rate, latency, tokens, and cost—plus guardrail score distributions that reveal drift and regressions at a glance.
 ### Monitor Data
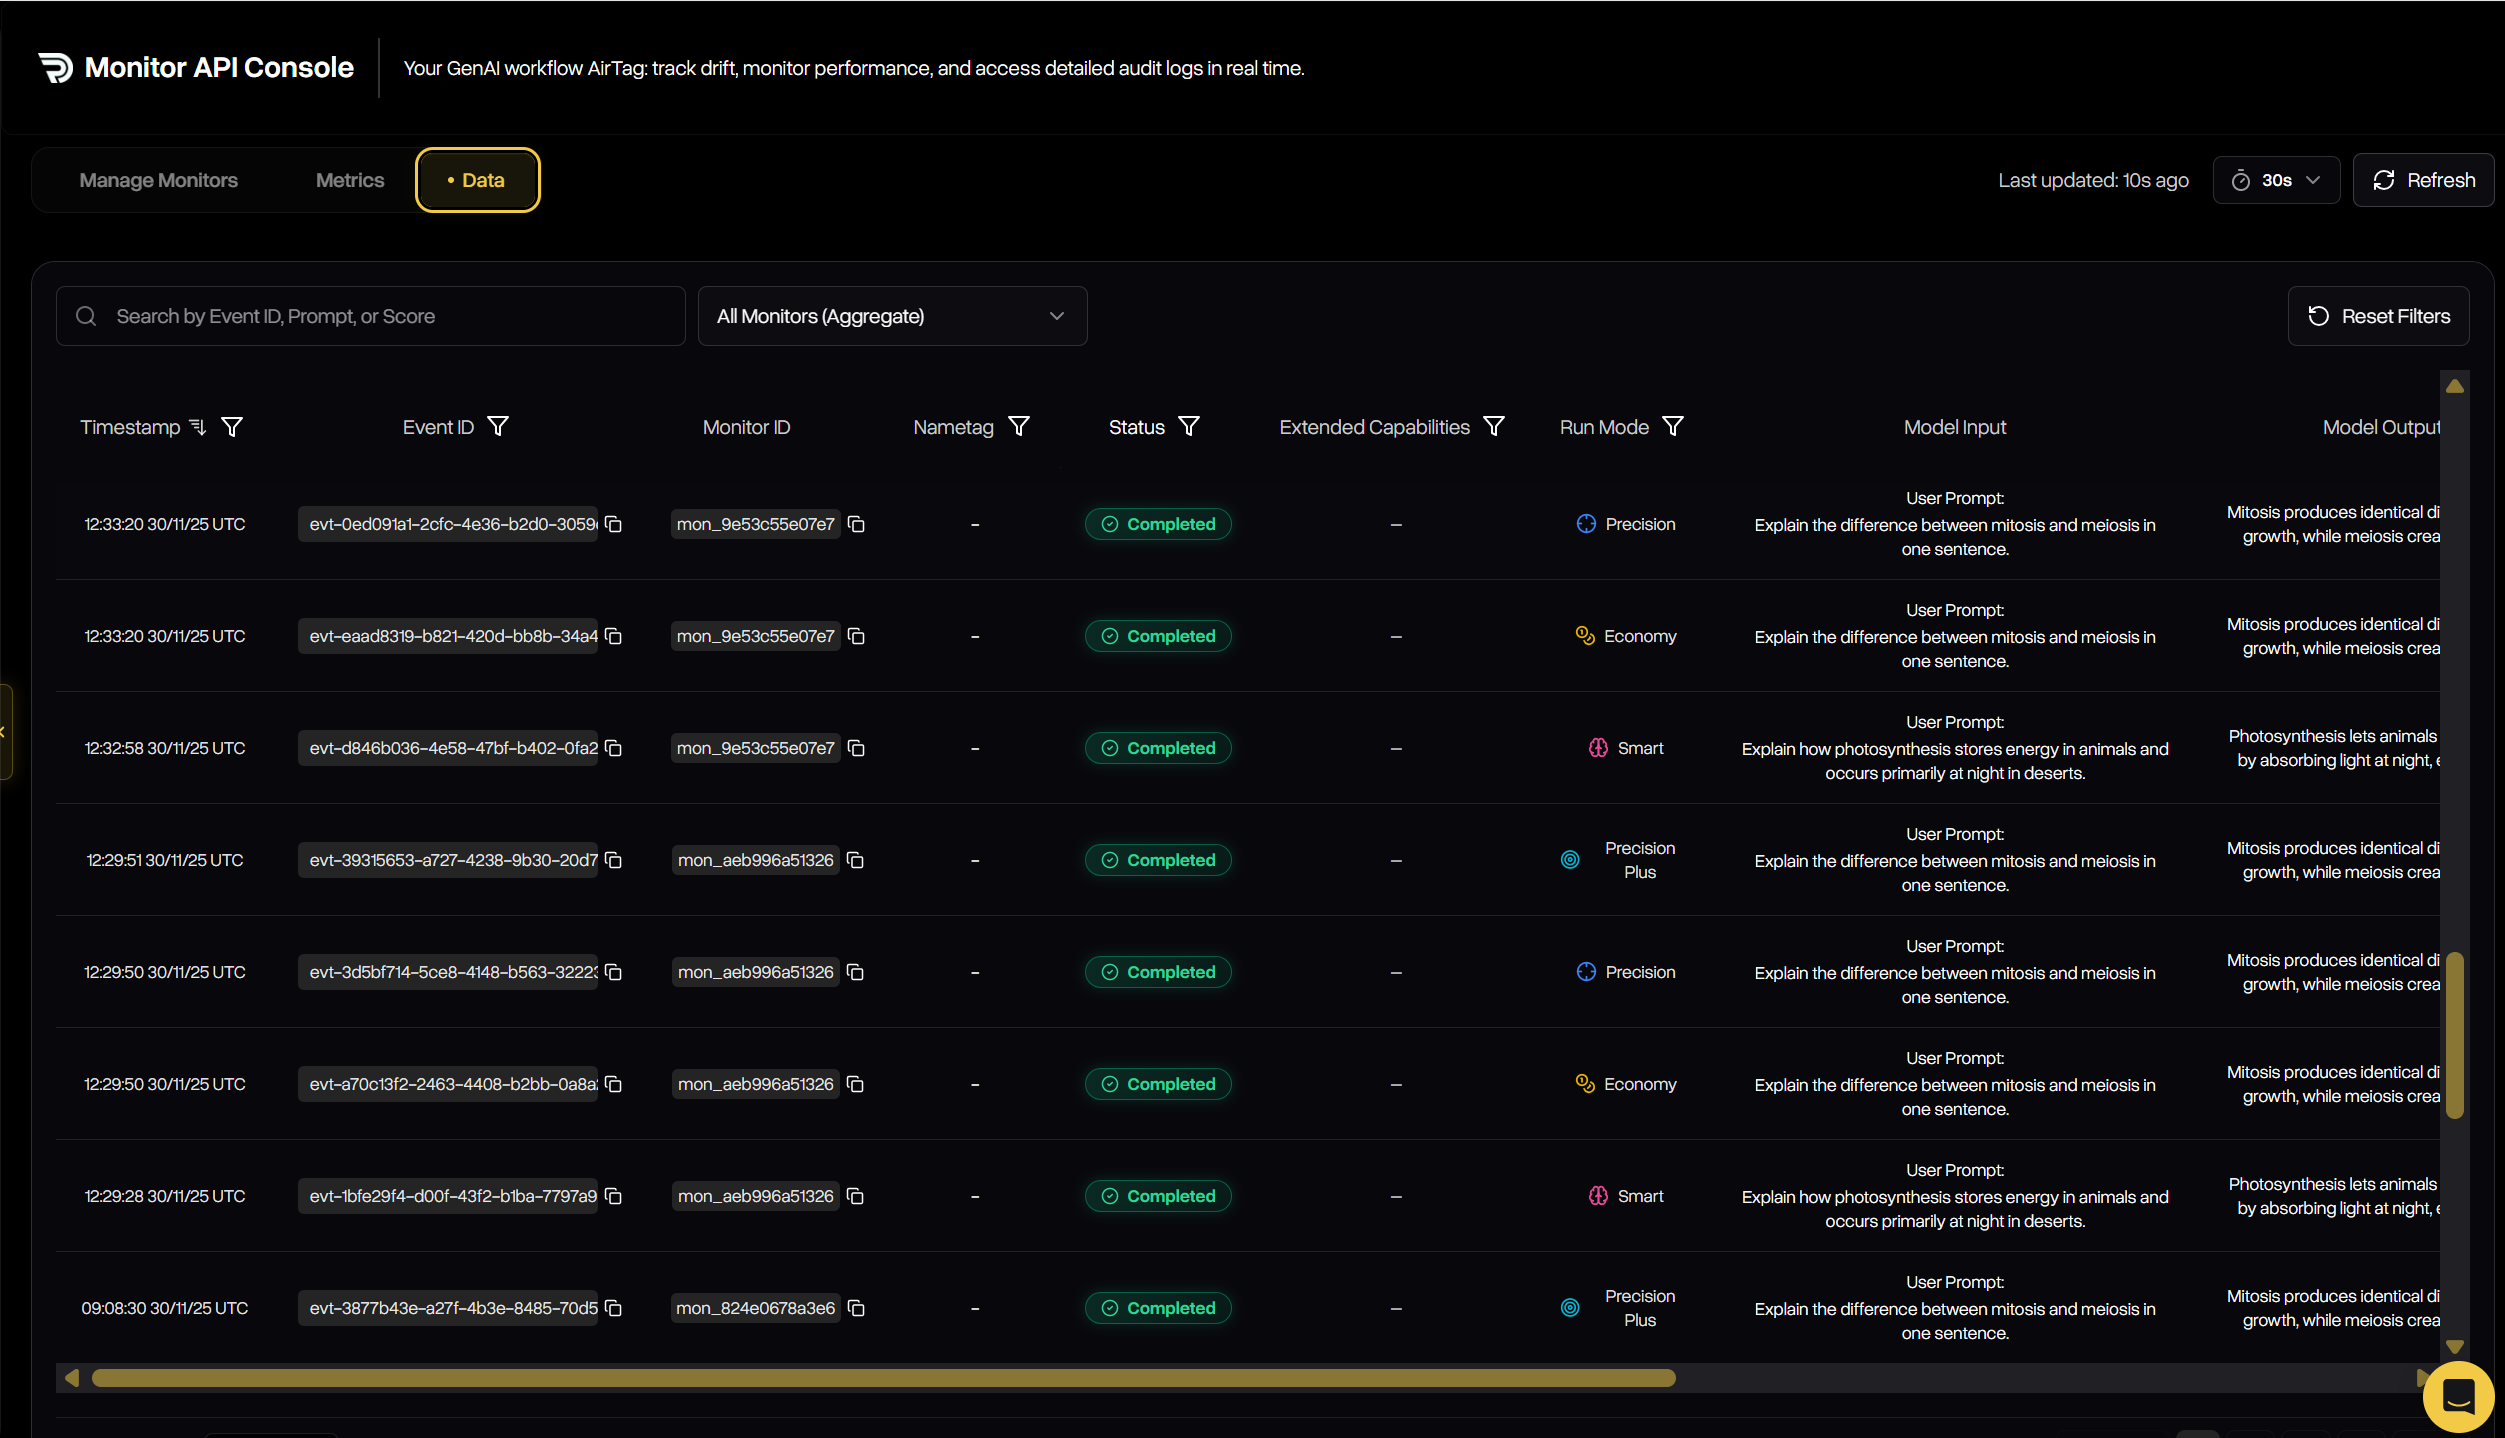
The **Monitor Data** tab lists every evaluated event for deep inspection. Filter by monitor, metrics, status, model, date range, or nametag; search by run ID or prompt; and open any row to view full details.
### Monitor Data
The **Monitor Data** tab lists every evaluated event for deep inspection. Filter by monitor, metrics, status, model, date range, or nametag; search by run ID or prompt; and open any row to view full details.
 ### Manage Monitors
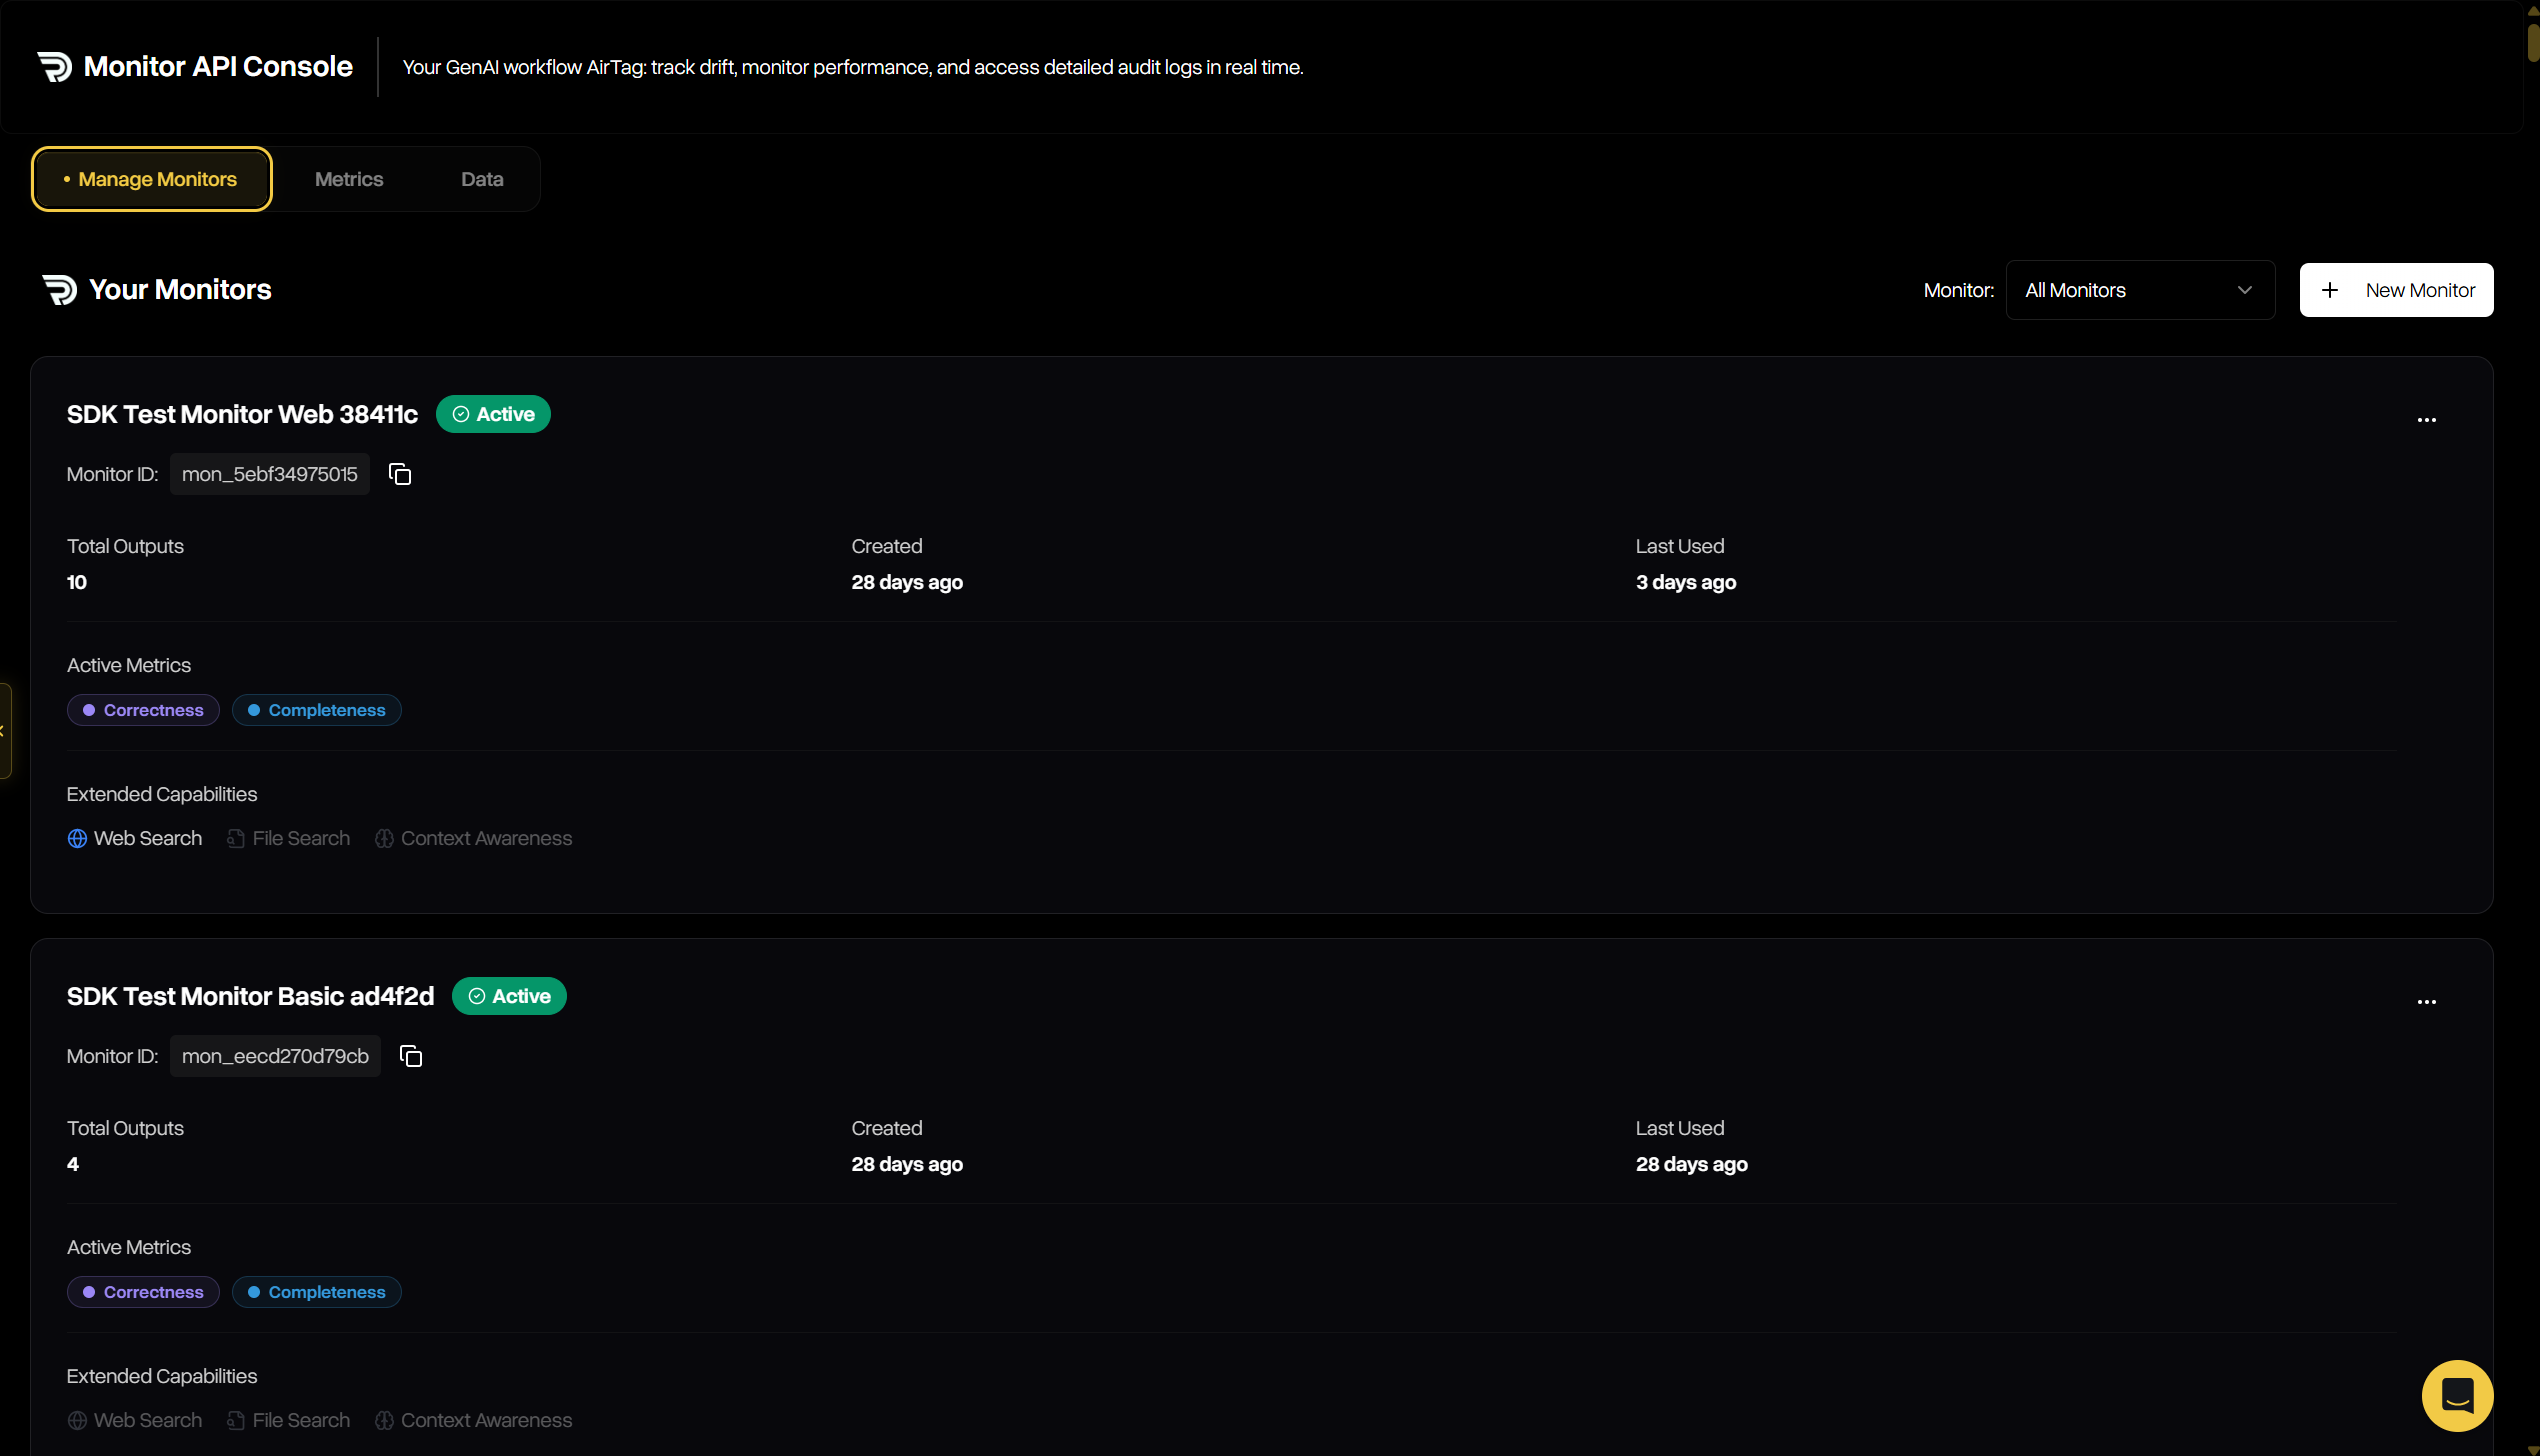
The **Manage Monitors** tab is where you create and maintain all monitors associated with your account. See when each monitor last received traffic, how many outputs it has evaluated, and more.
### Manage Monitors
The **Manage Monitors** tab is where you create and maintain all monitors associated with your account. See when each monitor last received traffic, how many outputs it has evaluated, and more.
 #### Creating a Monitor
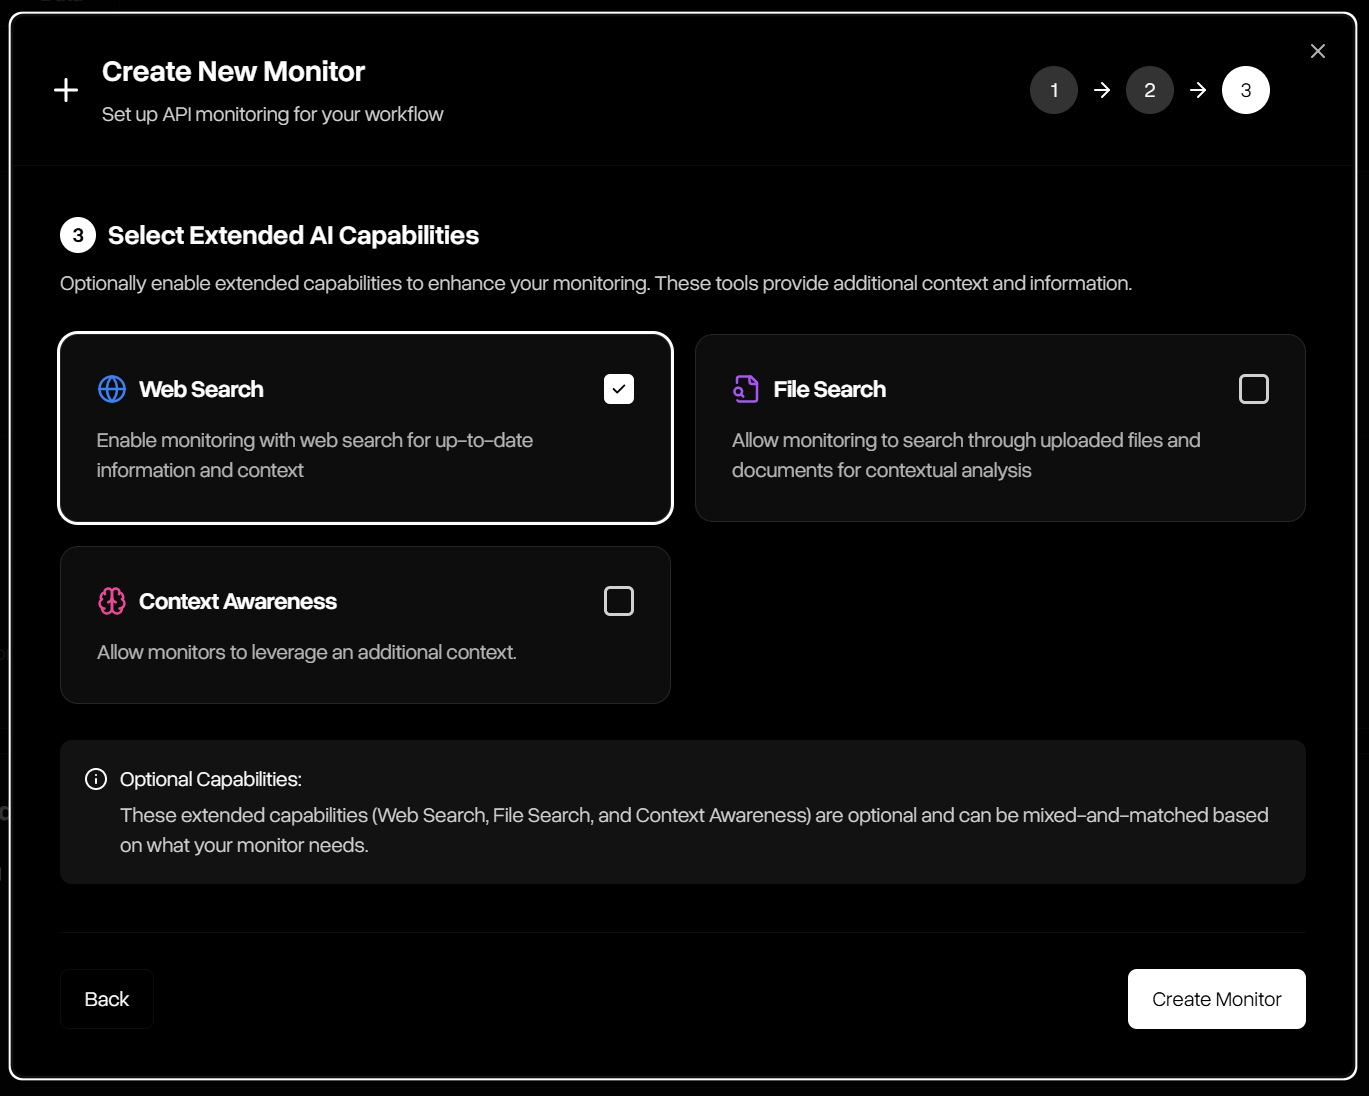
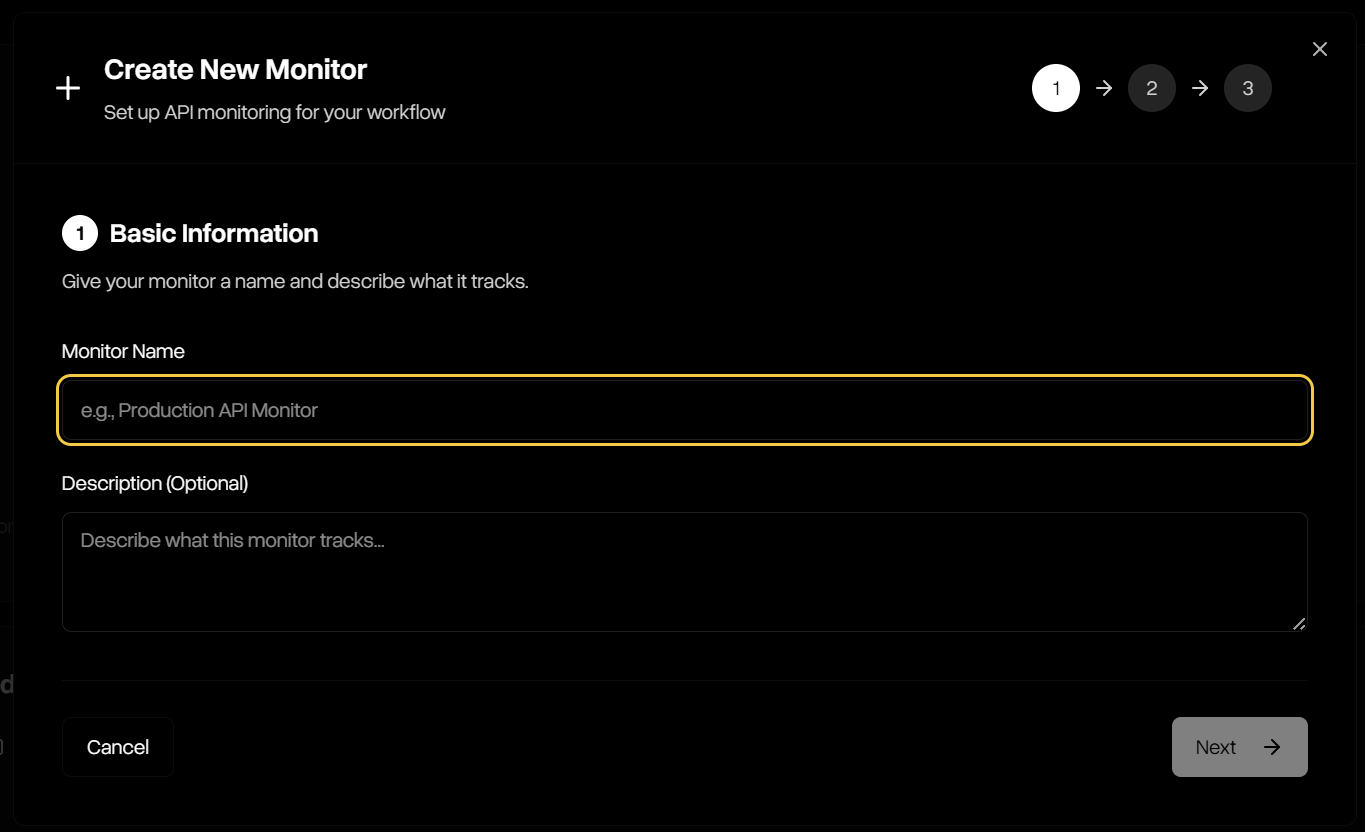
The creation wizard walks you through three simple steps to define how Monitor will analyze outputs:
Start by naming your monitor and (optionally) describing what it protects against. This helps keep monitors organized and clear for your team.
#### Creating a Monitor
The creation wizard walks you through three simple steps to define how Monitor will analyze outputs:
Start by naming your monitor and (optionally) describing what it protects against. This helps keep monitors organized and clear for your team.
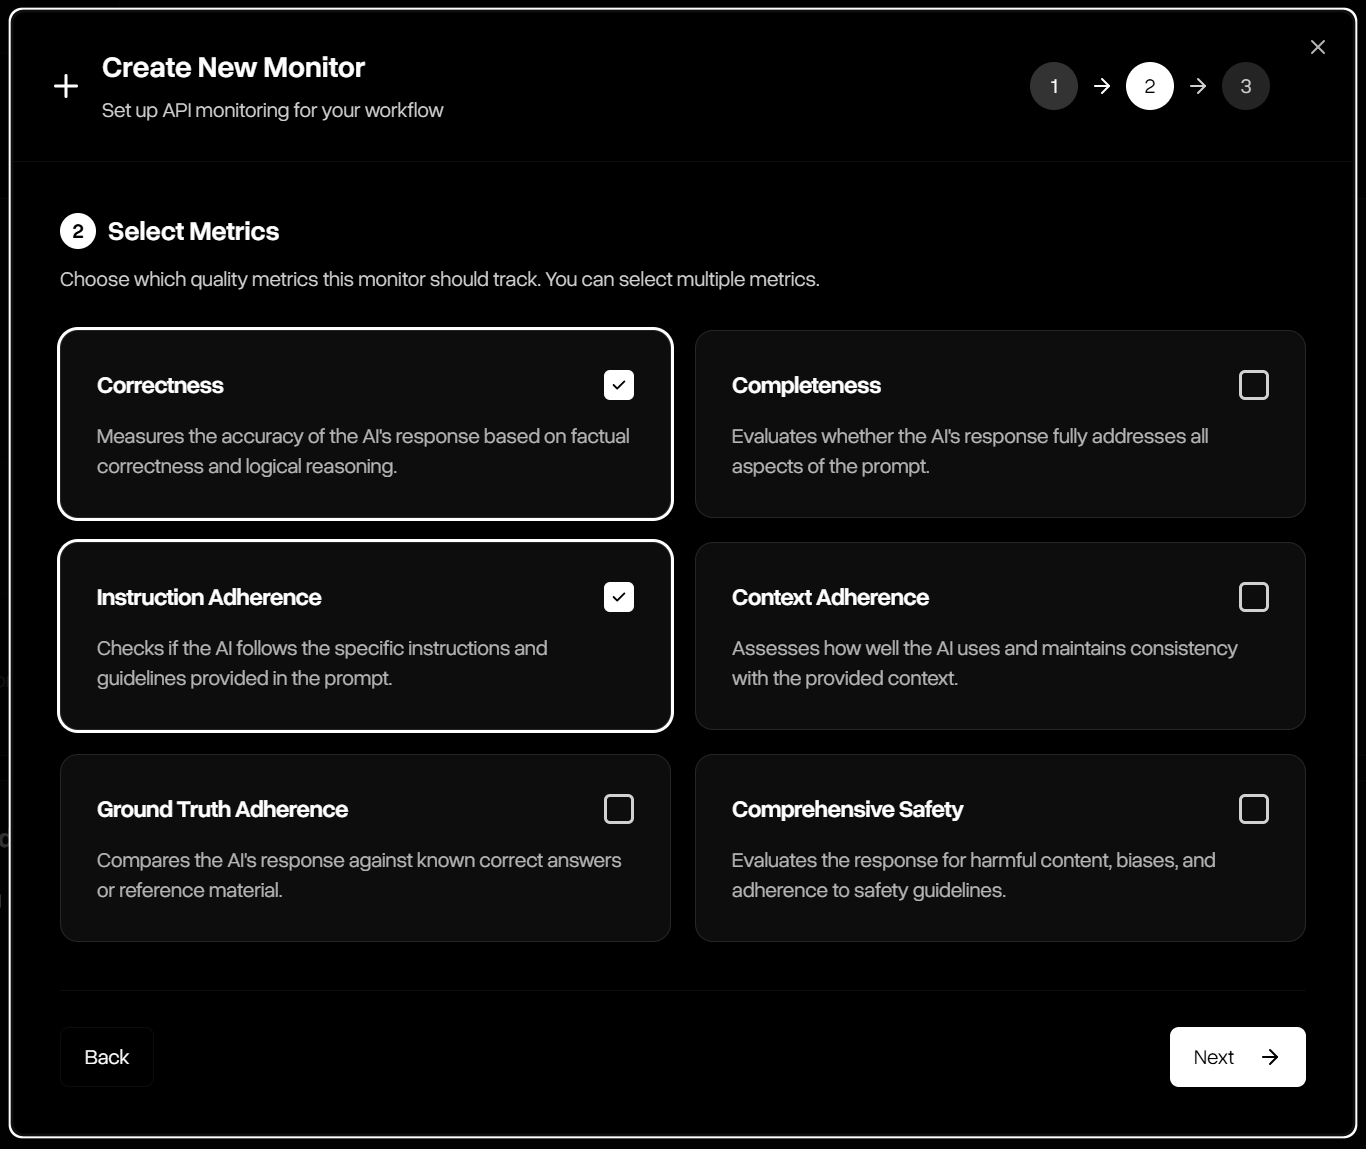
 Choose which guardrail metrics the monitor should analyze. Multiple guardrails can be combined, including correctness, completeness, adherence, and safety.
 Choose which additional tools will be needed to complete evaluations for your workflow. Each will add cost, so only select a tool if your initial model uses it.