Create an API Key
- In your organization’s DeepRails API Console, go to API Keys.
- Click Create key, name it, then copy the key.
- (Optional) Save it as the
DEEPRAILS_API_KEYenvironment variable.
Create and manage API keys in the API Console.
Install the SDK
- Python
- TypeScript / Node
- Ruby
- Go
pip install deeprails
npm install deeprails
gem install deeprails
go get github.com/deeprails/deeprails-go-sdk@latest
Create a Monitor
Before you can send events, you need to create a monitor. A monitor is a container for tracking production events and their evaluations. In this example, the evaluations in the monitor will leverage a file as context, which will need to be uploaded first.Tip: You can also create a monitor via the DeepRails API Console.
- Python
- TypeScript / Node
- Ruby
- Go
from deeprails import DeepRails, omit

# Initialize (env var DEEPRAILS_API_KEY is recommended)
client = DeepRails(api_key="YOUR_API_KEY")

try:

    with open("example.txt", "rb") as file:
        file_response = client.post(
            "/files/upload",
            cast_to=object,
            files={"files": file},
            options={"headers": {"Content-Type": omit}},
        )

    file_item = file_response[0] if isinstance(file_response, list) and file_response else file_response
    file_id = file_item.get("file_id") if isinstance(file_item, dict) else None
    if not file_id:
        raise ValueError("File upload failed")

    # Create a monitor
    monitor = client.monitor.create(
        name="Production Chat Assistant Monitor",
        description="Monitoring our production chatbot responses",
        guardrail_metrics=[
          "completeness",
          "correctness"
        ],
        web_search=True,
        file_search=[
          file_id
        ],
        context_awareness=True,
    )

    print(f"Monitor created:\n{monitor}")

except Exception as e:
    print(f"Error: {e}")
import DeepRails from "deeprails";
import * as fs from "fs";

async function main() {
  // Initialize (env var DEEPRAILS_API_KEY is recommended)
  const client = new DeepRails({
    apiKey: process.env.DEEPRAILS_API_KEY ?? "YOUR_API_KEY",
  });

  try {
    const fileStream = fs.createReadStream("example.txt");
    const files = [fileStream] as unknown as string[];
    const fileResponse = await client.files.upload({ files } as any);
    const fileItem = Array.isArray(fileResponse) ? fileResponse[0] : fileResponse;
    if (!fileItem?.file_id) {
      throw new Error("File upload failed");
    }
    const fileId = fileItem.file_id;

    // Create a monitor
    const monitor = await client.monitor.create({
      name: "Production Chat Assistant Monitor",
      description: "Monitoring our production chatbot responses",
      guardrail_metrics: ["completeness", "correctness"],
      web_search: true,
      file_search: [fileId],
      context_awareness: true,
    });

    console.log("Monitor created:", monitor);
  } catch (e) {
    console.error(`Error: ${e}`);
  }
}

main().catch(console.error);
require "deeprails"

# Initialize (env var DEEPRAILS_API_KEY is recommended)
client = Deeprails::Client.new(
  api_key: ENV["DEEPRAILS_API_KEY"] || "YOUR_API_KEY"
)

begin
  file_response = client.files.upload(
    files: [File.open("example.txt")]
  )
  file_item = file_response.is_a?(Array) ? file_response.first : file_response
  file_id = file_item.respond_to?(:file_id) ? file_item.file_id : file_item["file_id"]
  raise "File upload failed" if file_id.to_s.empty?

  # Create a monitor
  monitor = client.monitor.create(
    name: "Production Chat Assistant Monitor",
    description: "Monitoring our production chatbot responses",
    guardrail_metrics: [
      "completeness",
      "correctness"
    ],
    web_search: true,
    file_search: [
      file_id
    ],
    context_awareness: true,
  )

  puts "Monitor created:\n#{monitor}"
rescue => e
  puts "Error: #{e.message}"
end
package main

import (
	"bytes"
	"context"
	"encoding/json"
	"fmt"
	"io"
	"log"
	"mime/multipart"
	"net/http"
	"os"

	"github.com/deeprails/deeprails-go-sdk"
	"github.com/deeprails/deeprails-go-sdk/option"
)

func uploadFile(apiKey, path string) (string, error) {
	file, err := os.Open(path)
	if err != nil {
		return "", err
	}
	defer file.Close()

	body := &bytes.Buffer{}
	writer := multipart.NewWriter(body)

	part, err := writer.CreateFormFile("files", file.Name())
	if err != nil {
		return "", err
	}
	if _, err := io.Copy(part, file); err != nil {
		return "", err
	}
	if err := writer.Close(); err != nil {
		return "", err
	}

	req, err := http.NewRequest(http.MethodPost, "https://api.deeprails.com/files/upload", body)
	if err != nil {
		return "", err
	}
	req.Header.Set("Authorization", "Bearer "+apiKey)
	req.Header.Set("Content-Type", writer.FormDataContentType())

	resp, err := http.DefaultClient.Do(req)
	if err != nil {
		return "", err
	}
	defer resp.Body.Close()

	if resp.StatusCode >= http.StatusBadRequest {
		return "", fmt.Errorf("file upload failed with status %s", resp.Status)
	}

	var fileResponses []deeprails.FileResponse
	if err := json.NewDecoder(resp.Body).Decode(&fileResponses); err != nil {
		return "", err
	}
	if len(fileResponses) == 0 || fileResponses[0].FileID == "" {
		return "", fmt.Errorf("file upload failed")
	}

	return fileResponses[0].FileID, nil
}

func main() {
	apiKey := "YOUR_API_KEY"

	client := deeprails.NewClient(option.WithAPIKey(apiKey))

	fileID, err := uploadFile(apiKey, "example.txt")
	if err != nil {
		log.Fatal(err)
	}

	// Create a monitor
	monitorResponse, err := client.Monitor.New(context.TODO(), deeprails.MonitorNewParams{
		Name:        deeprails.F("Production Chat Assistant Monitor"),
		Description: deeprails.F("Monitoring our production chatbot responses"),
		GuardrailMetrics: deeprails.F([]deeprails.MonitorNewParamsGuardrailMetric{
			deeprails.MonitorNewParamsGuardrailMetricCorrectness,
			deeprails.MonitorNewParamsGuardrailMetricCompleteness,
		}),
		WebSearch:        deeprails.F(true),
		FileSearch:       deeprails.F([]string{fileID}),
		ContextAwareness: deeprails.F(true),
	})
	if err != nil {
		log.Fatal(err)
	}

	fmt.Printf("Monitor created with ID: %s\n", monitorResponse.MonitorID)
}
Required Parameters
| Field | Type | Description |
|---|---|---|
name | string | The human-readable name of the monitor |
guardrail_metrics | string[] | A list of one or more metrics that events associated with this monitor will be evaluated on |
Optional Parameters
| Field | Type | Description |
|---|---|---|
description | string | A description of the monitor and/or the associated production use case |
web_search | boolean | Whether or not web search is added as an extended capability for this monitor’s evaluations. Defaults to false |
file_search | string[] | A list of uploaded file IDs to be used for file search in this monitor’s evaluations. Upload files first via /files/upload. If nothing is passed, file search will not be used |
context_awareness | boolean | Whether or not context awareness is added as an extended capability for this monitor’s evaluations. Defaults to false |
Send Your First Monitor Event
Use the SDK to log a production event (input + output). The SDK automatically triggers an evaluation of the guardrail metrics assigned to the monitor and links the result to the event. Retrieve the details of the event until it gives acompleted status; then, you can view the outcome of the evaluation.
- Python
- TypeScript / Node
- Ruby
- Go
from deeprails import DeepRails
import time

# Initialize (env var DEEPRAILS_API_KEY is recommended)
client = DeepRails(api_key="YOUR_API_KEY")

# Create a monitor event (get the monitor_id from Console → Monitors)
created = client.monitor.submit_event(
    monitor_id="mon_xxxxxxxxxxxx",
    model_input={
        "system_prompt": "You are a helpful tutor specializing in AP science classes.",
        "user_prompt": "Explain the difference between mitosis and meiosis in one sentence.",
        "context": [{"role": "user", "content": "I have an AP Bio exam tomorrow, can you help me study?"}, {"role": "tutor", "content": "Sure, I'll help you study."}]
    },
    model_output="Mitosis produces two genetically identical diploid cells for growth and tissue repair, whereas meiosis generates four genetically varied haploid gametes for sexual reproduction.",
    run_mode="fast",
)

print(created)

time.sleep(5)

status = ""
while status != "completed":
  time.sleep(1)
  event = client.monitor.retrieve_event(event_id=created.event_id, monitor_id=created.monitor_id)
  status = event.status

print(event.evaluation_result)
import DeepRails from "deeprails";

async function main() {
  // Initialize (env var DEEPRAILS_API_KEY is recommended)
  const client = new DeepRails({
    apiKey: process.env.DEEPRAILS_API_KEY ?? "YOUR_API_KEY",
  });

  // Create a monitor event (get the monitor_id from Console → Monitors)
  const created = await client.monitor.submitEvent(
    "mon_xxxxxxxxxxxx",
    {
      model_input: {
        system_prompt: "You are a helpful tutor specializing in AP science classes.",
        user_prompt: "Explain the difference between mitosis and meiosis in one sentence.",
        context: [
          { role: "user", content: "I have an AP Bio exam tomorrow, can you help me study?" },
          { role: "tutor", content: "Sure, I'll help you study." }
        ],
      },
      model_output: "Mitosis produces two genetically identical diploid cells for growth and tissue repair, whereas meiosis generates four genetically varied haploid gametes for sexual reproduction.",
      run_mode: "fast",
    }
  );

  console.log(created);

  await new Promise(resolve => setTimeout(resolve, 5000));

  let status = "";
  let event;
  while (status !== "completed") {
    await new Promise(resolve => setTimeout(resolve, 1000));
    event = await client.monitor.retrieveEvent(created.event_id, {
      monitor_id: created.monitor_id,
    });
    status = event.status ?? "";
  }

  console.log(event?.evaluation_result);
}

main().catch(console.error);
require "deeprails"

# Initialize (env var DEEPRAILS_API_KEY is recommended)
client = Deeprails::Client.new(
  api_key: ENV["DEEPRAILS_API_KEY"] || "YOUR_API_KEY"
)

# Create a monitor event (get the monitor_id from Console → Monitors)
created = client.monitor.submit_event(
  "mon_xxxxxxxxxxxx",
  {
    model_input: {
      system_prompt: "You are a helpful tutor specializing in AP science classes.",
      user_prompt: "Explain the difference between mitosis and meiosis in one sentence.",
      context: [
        { role: "user", content: "I have an AP Bio exam tomorrow, can you help me study?" },
        { role: "tutor", content: "Sure, I'll help you study." }
      ]
    },
    model_output: "Mitosis produces two genetically identical diploid cells for growth and tissue repair, whereas meiosis generates four genetically varied haploid gametes for sexual reproduction.",
    run_mode: "fast",
  }
)

puts created

sleep(5)

status = nil
while status != :completed
  sleep(1)
  event = client.monitor.retrieve_event(created.event_id, monitor_id: created.monitor_id)
  status = event.status
end

puts event.evaluation_result
package main

import (
	"context"
	"fmt"
	"log"
	"time"

	"github.com/deeprails/deeprails-go-sdk"
	"github.com/deeprails/deeprails-go-sdk/option"
)

func main() {
	apiKey := "YOUR_API_KEY"

	client := deeprails.NewClient(option.WithAPIKey(apiKey))

	// Create a monitor event (get the monitor_id from Console → Monitors)
	created, err := client.Monitor.SubmitEvent(context.TODO(),
		"mon_xxxxxxxxxxxx",
		deeprails.MonitorSubmitEventParams{
			ModelInput: deeprails.F(deeprails.MonitorSubmitEventParamsModelInput{
				SystemPrompt: deeprails.F("You are a helpful tutor specializing in AP science classes."),
				UserPrompt:   deeprails.F("Explain the difference between mitosis and meiosis in one sentence."),
				Context: deeprails.F([]deeprails.MonitorSubmitEventParamsModelInputContext{
					{Role: deeprails.F("user"), Content: deeprails.F("I have an AP Bio exam tomorrow, can you help me study?")},
					{Role: deeprails.F("tutor"), Content: deeprails.F("Sure, I'll help you study.")},
				}),
			}),
			ModelOutput: deeprails.F("Mitosis produces two genetically identical diploid cells for growth and tissue repair, whereas meiosis generates four genetically varied haploid gametes for sexual reproduction."),
			RunMode:     deeprails.F(deeprails.MonitorSubmitEventParamsRunModeFast),
		},
	)

	if err != nil {
		log.Fatal(err)
	}

	fmt.Printf("Event created: %+v\n", created)

	time.Sleep(5 * time.Second)

	var event *deeprails.MonitorEventDetailResponse
	for event == nil || event.Status != deeprails.MonitorEventDetailResponseStatusCompleted {
		time.Sleep(1 * time.Second)
		var err error
		event, err = client.Monitor.GetEvent(context.TODO(), created.MonitorID, created.EventID)
		if err != nil {
			log.Fatal(err)
		}
	}

	fmt.Printf("Evaluation Result:\n%+v\n", event.EvaluationResult)
}
Required Parameters
| Field | Type | Description |
|---|---|---|
monitor_id | string | The ID of the monitor to receive the event (find it in Console → Monitor → Manage Monitors). |
model_input | object | Must include at least a user_prompt. |
model_output | string | The LLM output to be evaluated and recorded with the event. |
Optional Parameters
| Field | Type | Description |
|---|---|---|
run_mode | string | Run mode for the monitor event that determines which models are used to evaluate the event. Available run modes (fastest to most thorough): super_fast, fast, precision, precision_codex, precision_max, and precision_max_codex. Defaults to fast. Note: super_fast does not support Web Search or File Search — if your monitor has these enabled, use a different run mode or edit the monitor to disable them. |
Retrieve Monitor and Event Details
You can retrieve a monitor’s details via API including a list of recent events and stats on associated evaluation progress.- Python
- TypeScript / Node
- Ruby
- Go
from deeprails import DeepRails

client = DeepRails(api_key="YOUR_API_KEY")

try:
    # Get monitor details
    monitor = client.monitor.retrieve(monitor_id="mon_xxxxxxxxxxxx")
    print(monitor)
except Exception as e:
    print(f"Error: {e}")
import DeepRails from "deeprails";

async function main() {
  const client = new DeepRails({
    apiKey: process.env.DEEPRAILS_API_KEY ?? "YOUR_API_KEY",
  });

  try {
    // Get monitor details
    const monitor = await client.monitor.retrieve("mon_xxxxxxxxxxxx");
    console.log(monitor);
  } catch (e) {
    console.error(`Error: ${e}`);
  }
}

main().catch(console.error);
require "deeprails"

client = Deeprails::Client.new(
  api_key: ENV["DEEPRAILS_API_KEY"] || "YOUR_API_KEY"
)

begin
  # Get monitor details
  monitor = client.monitor.retrieve("mon_xxxxxxxxxxxx")
  puts monitor
rescue => e
  puts "Error: #{e.message}"
end
package main

import (
	"context"
	"fmt"
	"log"

	"github.com/deeprails/deeprails-go-sdk"
	"github.com/deeprails/deeprails-go-sdk/option"
)

func main() {
	apiKey := "YOUR_API_KEY"

	client := deeprails.NewClient(option.WithAPIKey(apiKey))

	// Get monitor details
	monitor, err := client.Monitor.Get(context.TODO(), "mon_xxxxxxxxxxxx", deeprails.MonitorGetParams{})
	if err != nil {
		log.Fatal(err)
	}

	fmt.Printf("%+v\n", monitor)
}
Check Monitor Analytics via the API Console
- Open DeepRails API Console → Monitor → Data.
- Filter by model, time range, or search by
monitor_idto find events. - Open any event to see the linked evaluation scores and rationales.
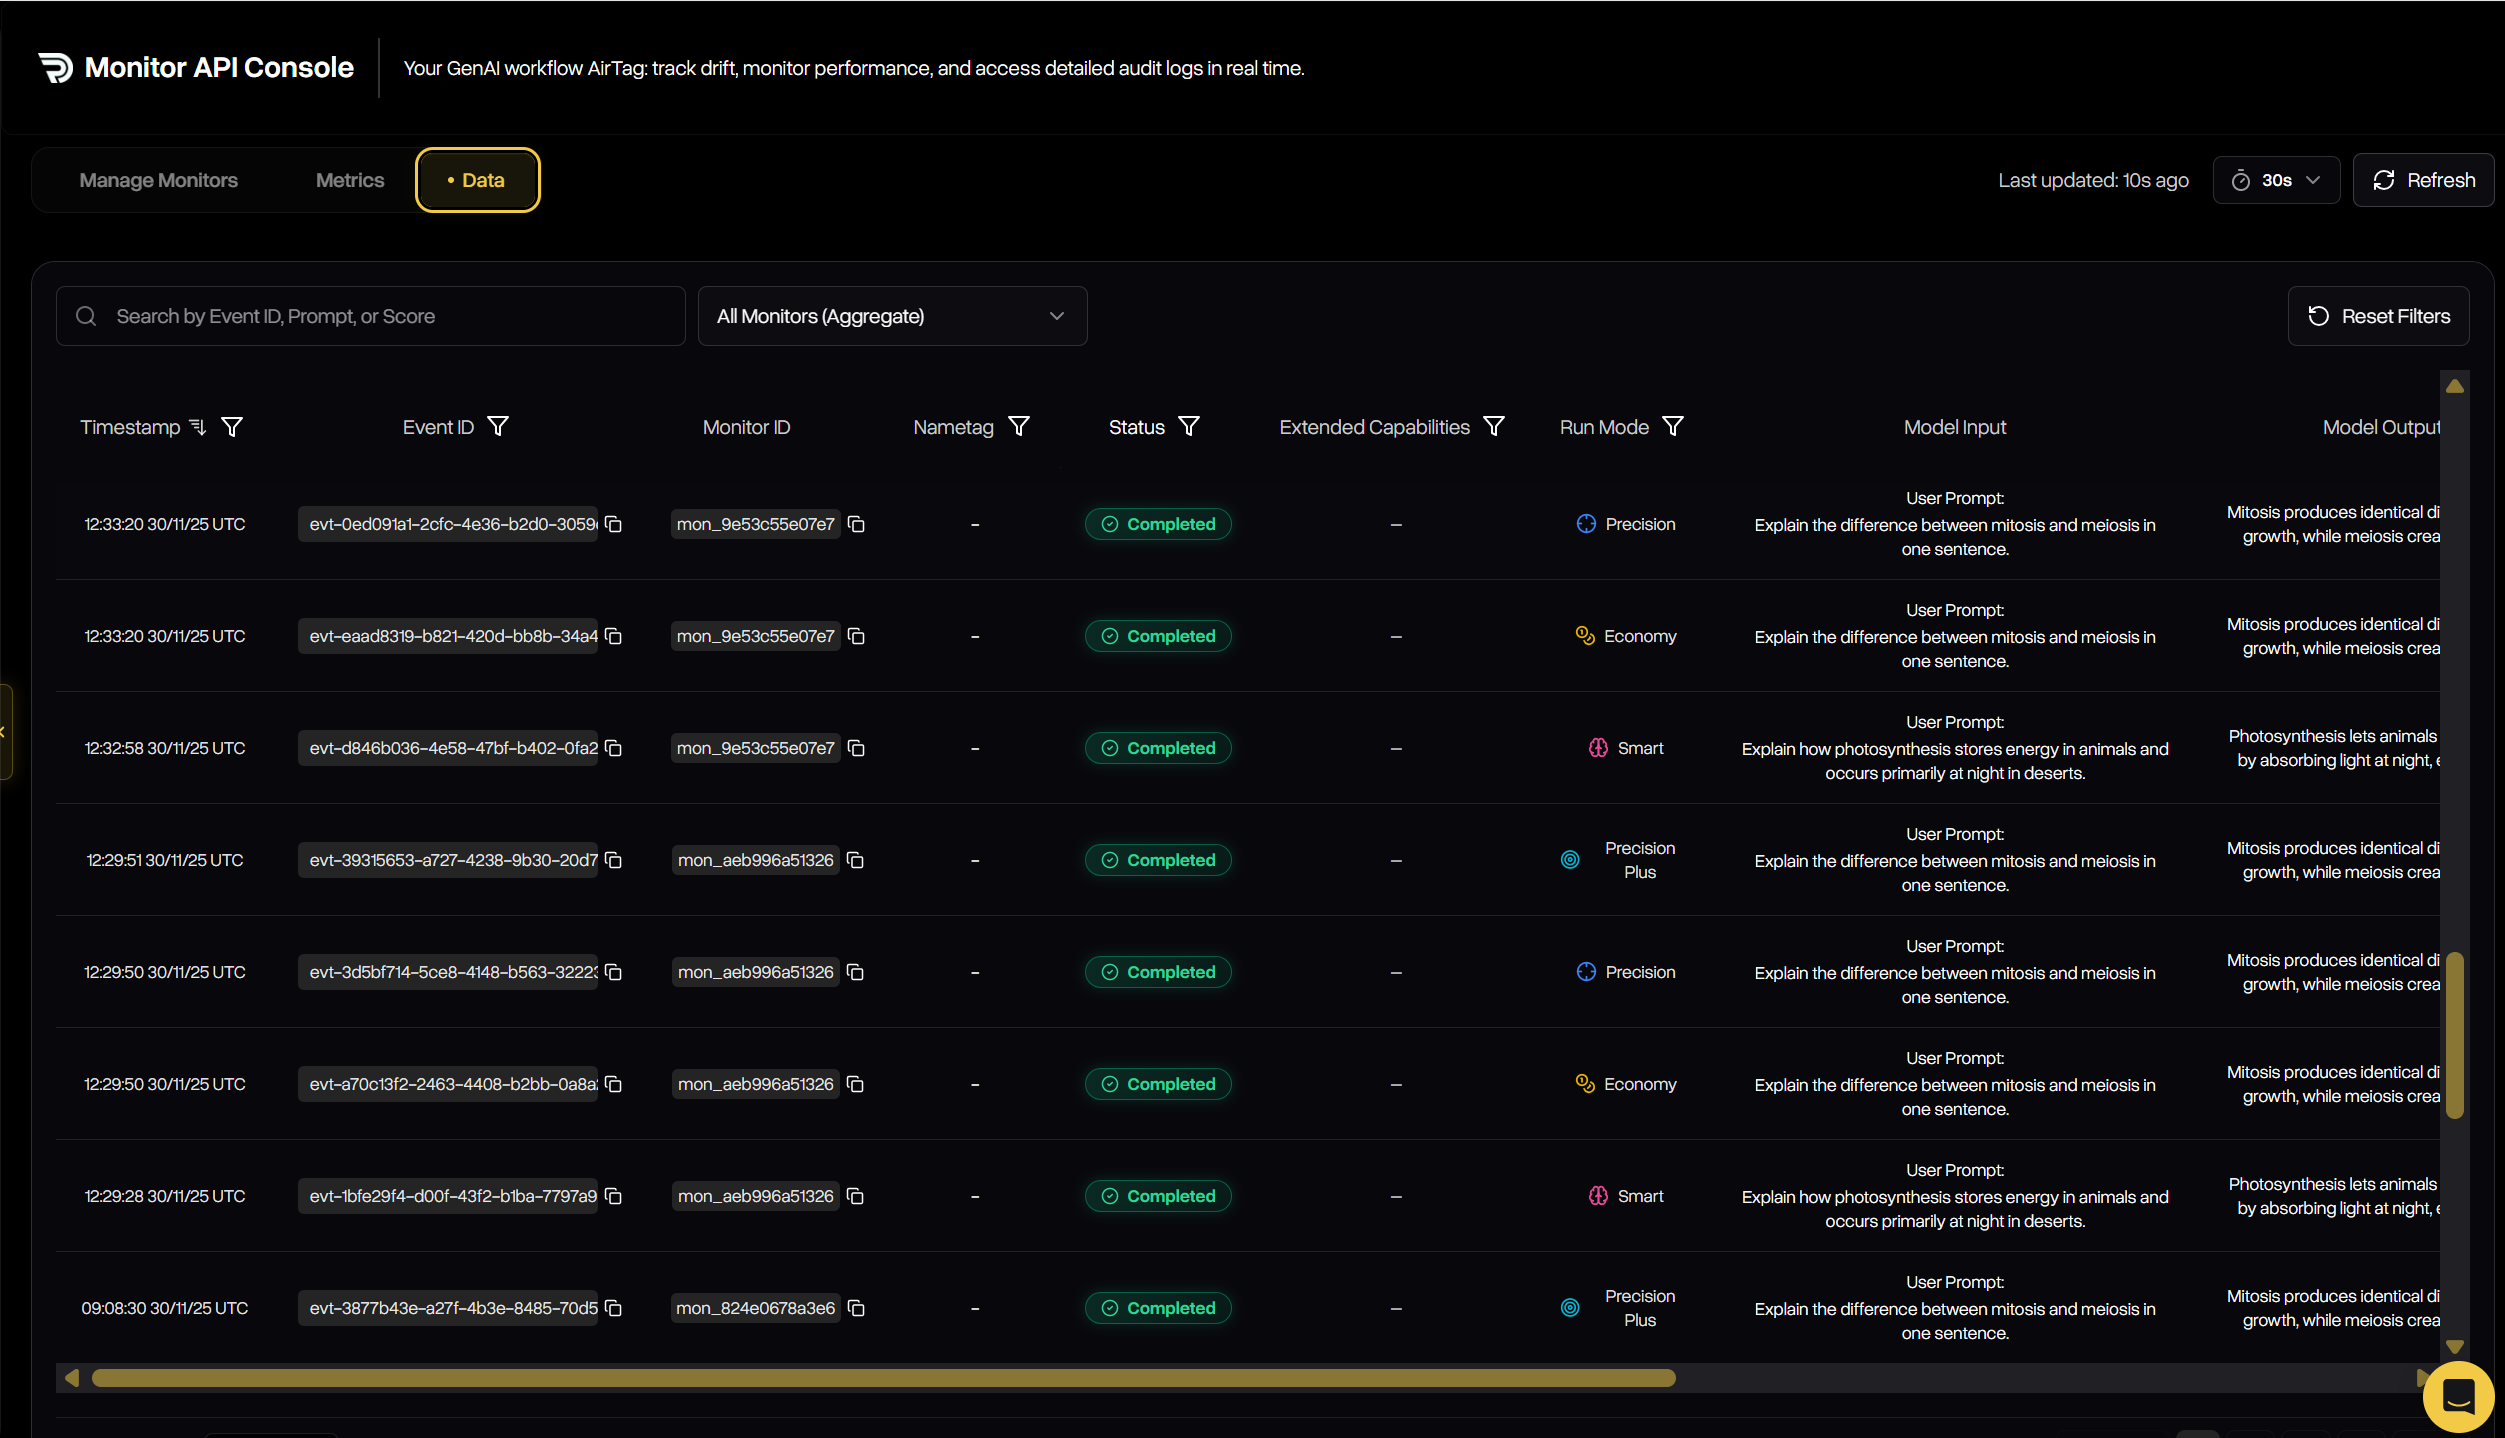
Browse real-time monitor events, filters, and linked evaluation details.
Next Steps
Learn About Guardrails
Explore the metrics behind evaluations—correctness, safety, completeness, and more.
Monitor Overview
Learn core Monitor concepts and how it fits into your flow.